|
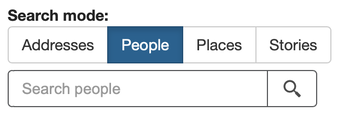
Our team has been working behind the scenes for months to improve your experience in the Explore App. These functionality upgrades are just the beginning of a larger redesign that will be happening over the next 18 months. When COVID-19 in under control and we can host public design charrettes again, we will be asking you—our users—for feedback. But in the meantime, please try out the new functionalities and let us know what you think in the comments. GLOBAL SEARCH With this new version, searching for people, places, and stories will be a lot easier, as will sharing what you find on the Time Traveler. Instead of searching by Address, Person, Place, or Story, there will only be one search bar where you can search keywords in every category.
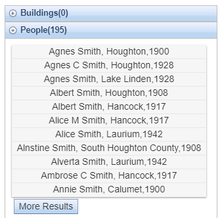
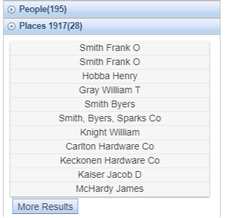
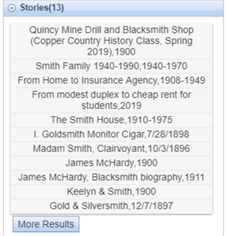
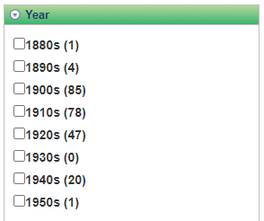
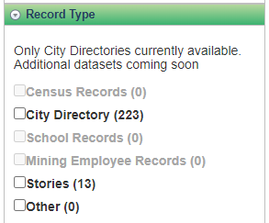
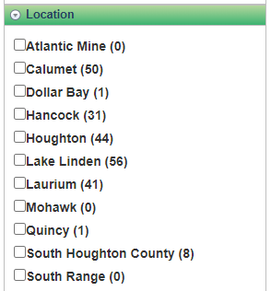
Your search results will be reported in the categories of Buildings, People, Places, and Stories with parenthetical numbers to tell you how many results you got in each category. For instance, the results below appear after you enter "Smith" in the Global Search bar, which results in 195 people, 28 places (which includes businesses), and 13 stories. Clicking on any of these results will take you to that location on a map closest to the year of the record. FILTER RESULTS
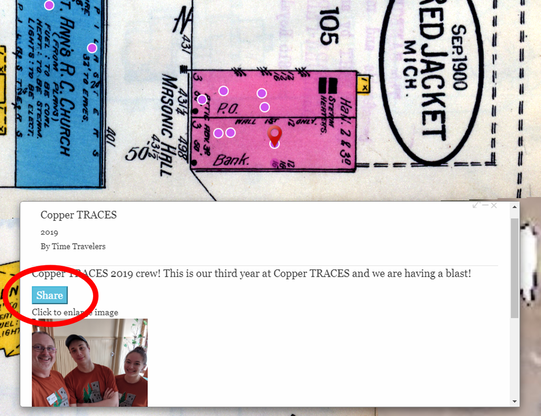
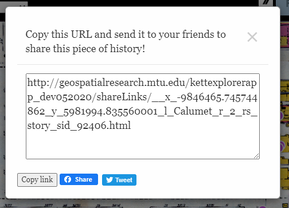
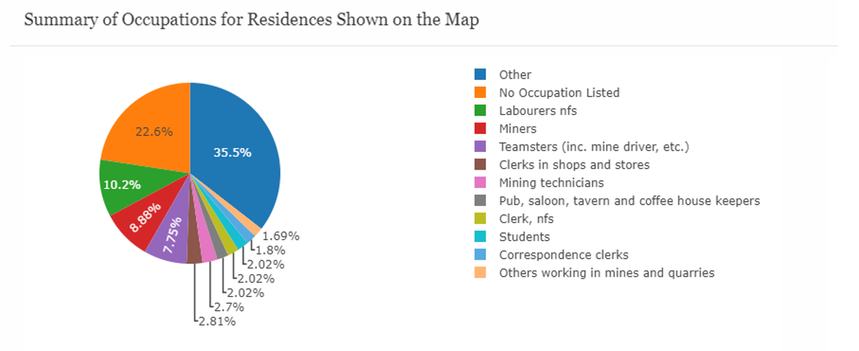
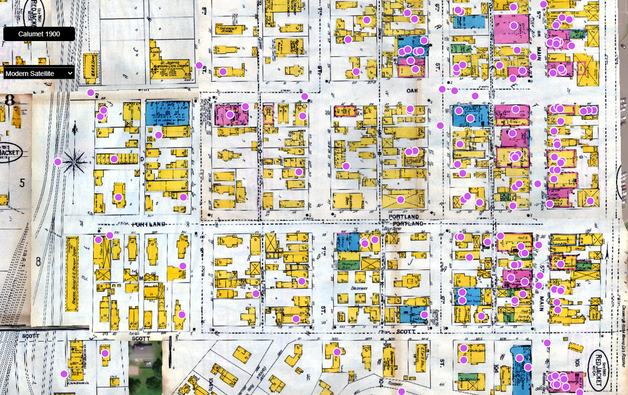
SHARING SEARCH RESULTS One major upgrade introduced today is the ability to share your results with friends using a distinct web address. When you find a map and search results that you want to share, click the blue "Share" button to get a link that will take other users to exactly the search results and map view that you created. This way you can share an interesting building, person, or fun story on social media, in an email, or embed it on your own website! Just click on the blue Share button to get a shareable URL. SUMMARY OF OCCUPATIONS Have you ever wanted to find a neighborhood where trammers worked and lived? Or are you looking for foundry workers or lumbermen? You can now see a pie chart of all the occupations for people living in the range of the map you are viewing. These occupations are as listed in the City Directories. These occupations and their percentages will change as you zoom and pan around the map, changing with what houses and people are in view. With this feature you can see how neighborhoods change throughout time and across towns. Below is the pie chart for a section of Calumet in the 1900s. Thank you to the students in Dr. Robert Pastel's computer science course who worked to build these new functionalities, especially Mason Sayles, who helped us implement it over Summer 2020.
0 Comments
Leave a Reply. |
|

 RSS Feed


